Ease of Movement
Volume, EOM
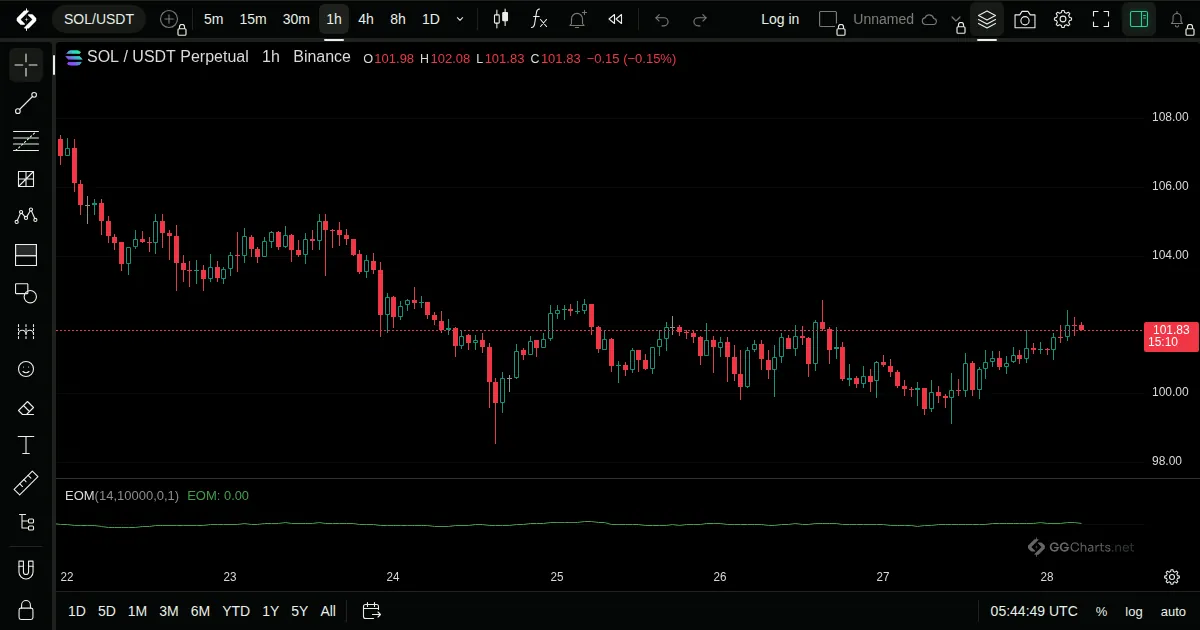
- What it shows
Shows how easily price moves, by comparing the shift of the bar's midpoint with the volume needed for it.
- How it is built
The midpoint's change is divided by the ratio of volume to the bar's range, then averaged.
Default: Length 14, divisor 10000.
- How traders read it
- Above zero: price moves up with little volume.
- Below zero: price falls easily.
- Near zero: it takes a lot of volume to move price.