Chaikin Money Flow
Volume, CMF
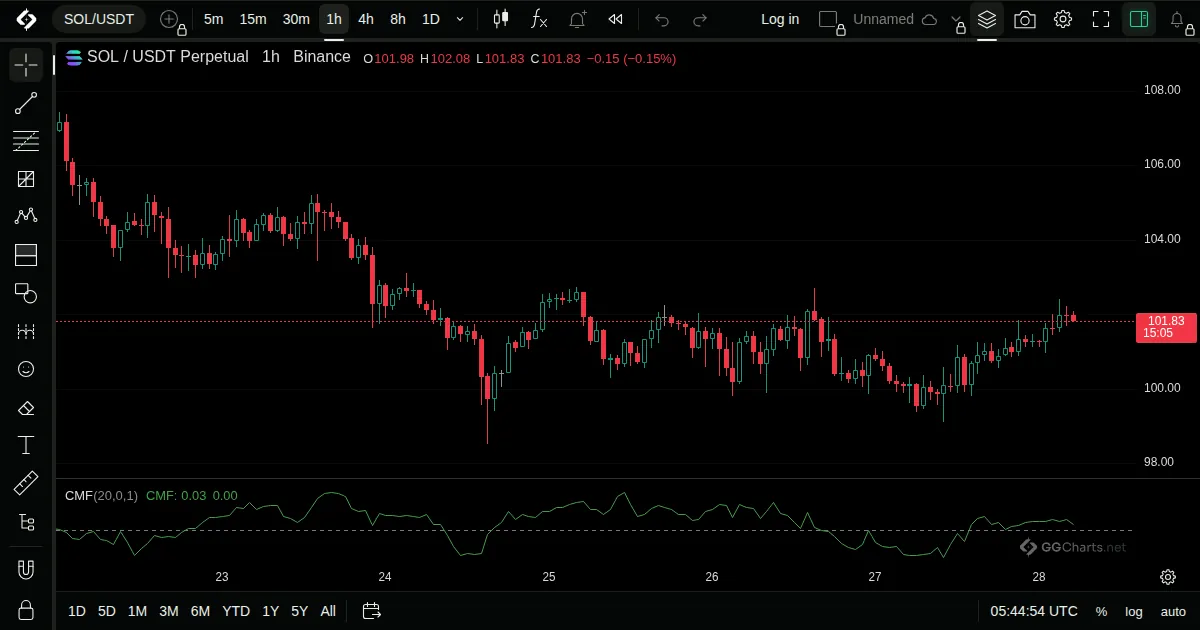
- What it shows
Shows whether volume has been going in on the buying or the selling side over the period.
- How it is built
It sums the money flow volume of each bar, positive if the close is in the upper part of the bar's range, and divides it by total volume.
Default: Length 20.
- How traders read it
- Above zero: buying pressure. Below zero: selling pressure.
- Values far from zero show strong pressure.
- Crossing zero shows a change of balance.
Related indicators
Chaikin OscillatorAccumulation/DistributionElder Force IndexKlinger Oscillator