Money Flow Index
Volume, MFI
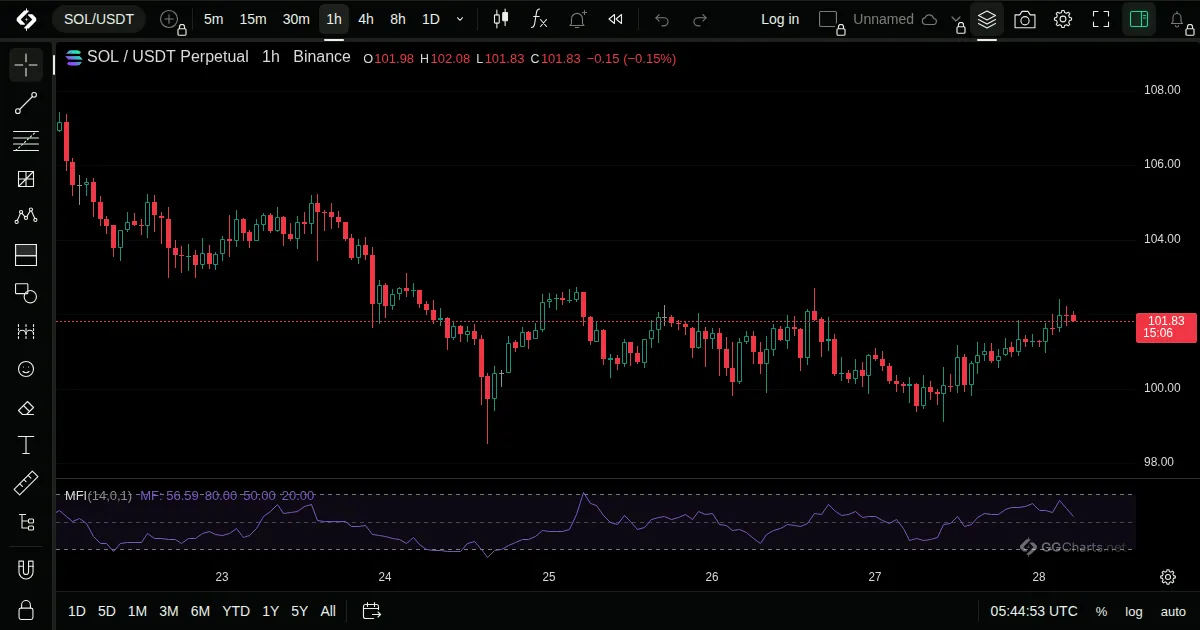
- What it shows
An oscillator like RSI that includes volume, so it shows buying and selling pressure in money terms.
- How it is built
The typical price times volume is split into up and down flows, and their ratio is scaled to 0 to 100.
Default: Length 14.
- How traders read it
- Above 80 is read as overbought, below 20 as oversold.
- A divergence from price is a warning.
- Volume makes it respond to participation.
Related indicators
Chaikin Money FlowChaikin OscillatorAccumulation/DistributionElder Force Index