Accumulation/Distribution
Volume, Accum/Dist
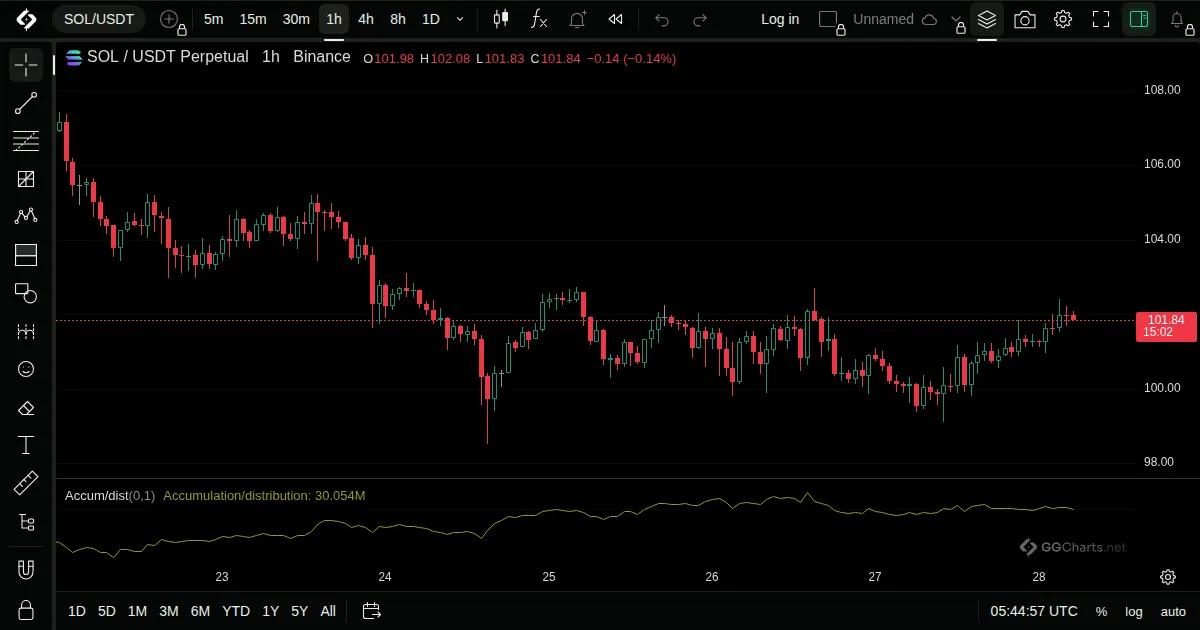
- What it shows
A running total of volume weighted by where each bar closes within its range.
- How it is built
Each bar adds its volume multiplied by how close the close is to the high, up to 1, or to the low, down to -1.
Default: No inputs.
- How traders read it
- A rising line shows accumulation.
- A falling line shows distribution.
- A divergence from price is a warning.
Related indicators
Elder Force IndexKlinger OscillatorPercentage Volume OscillatorNegative Volume Index