Negative Volume Index
Volume, NVI
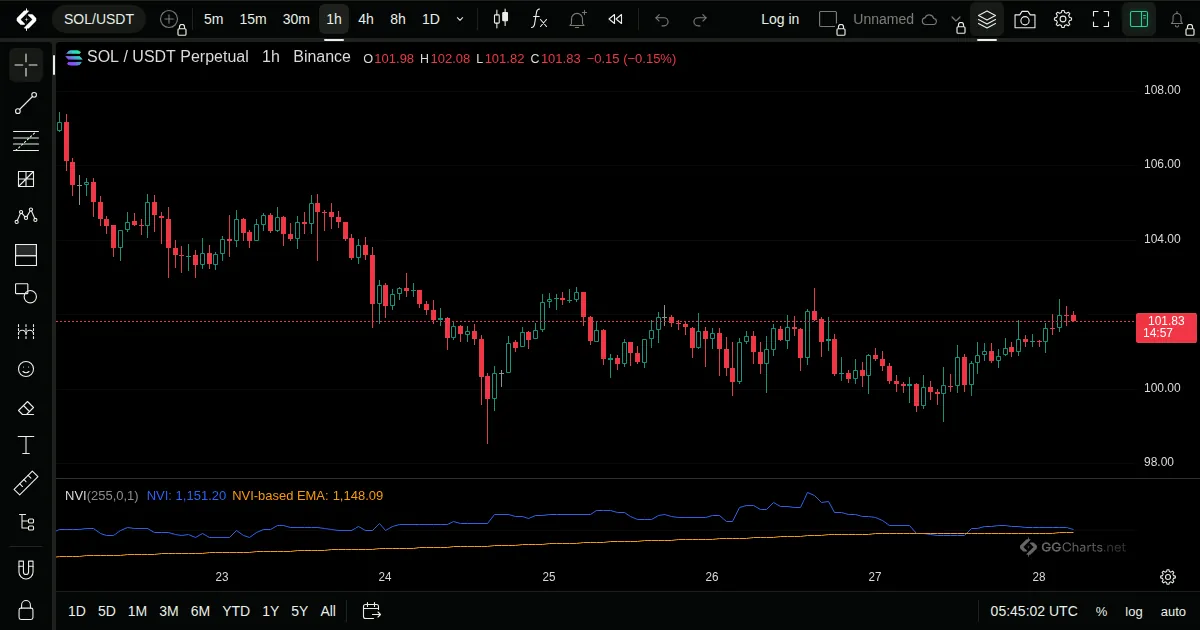
- What it shows
An index that changes only on bars when volume fell from the previous one.
- How it is built
On days with lower volume the index moves by the percent change of price, otherwise it stays.
Default: EMA length 255.
- How traders read it
- Shows what price does when volume is low.
- Compared with its long average.
- Mostly used on daily charts.
Related indicators
Positive Volume IndexRelative Volume at TimeVolumeVWAP
Percentage Volume Oscillator← All indicatorsPositive Volume Index