Klinger Oscillator
Volume
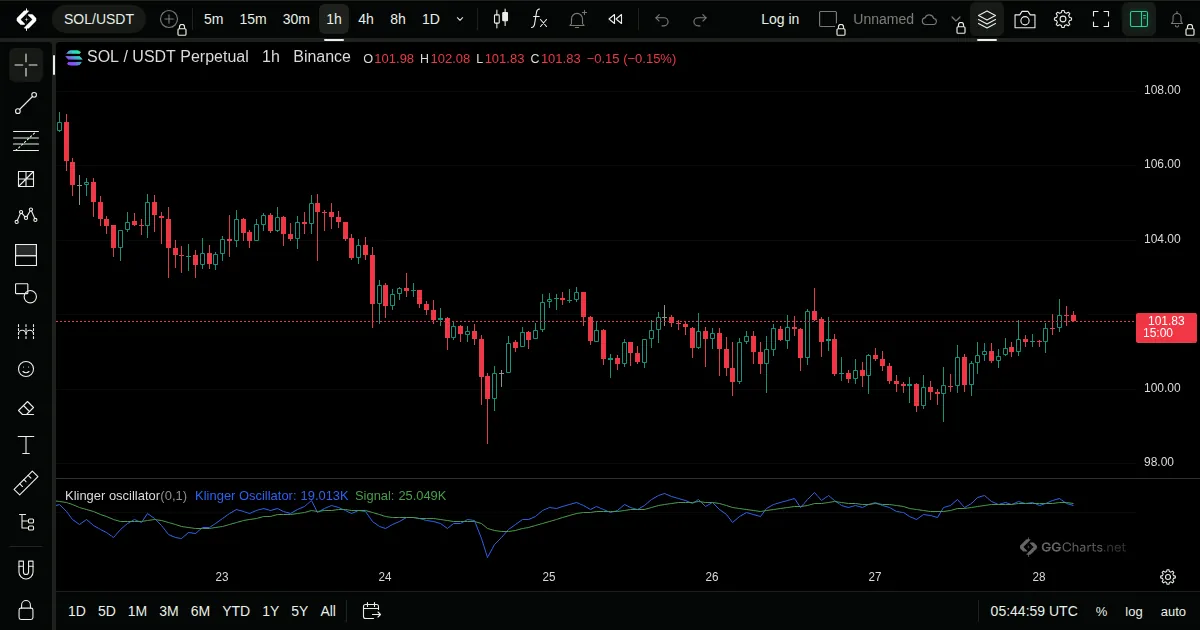
- What it shows
Compares the volume flowing into a market with a long-term and a short-term average, to show the pressure behind the trend.
- How it is built
A volume force is calculated from the bar's range and trend, and the gap between a fast and a slow EMA of it is plotted with a signal line.
Default: No inputs.
- How traders read it
- A cross of the signal line is the usual signal.
- Above zero: buying pressure.
- A divergence from price is a warning.
Related indicators
Percentage Volume OscillatorNegative Volume IndexPositive Volume IndexRelative Volume at Time
Elder Force Index← All indicatorsPercentage Volume Oscillator