McGinley Dynamic
Trend
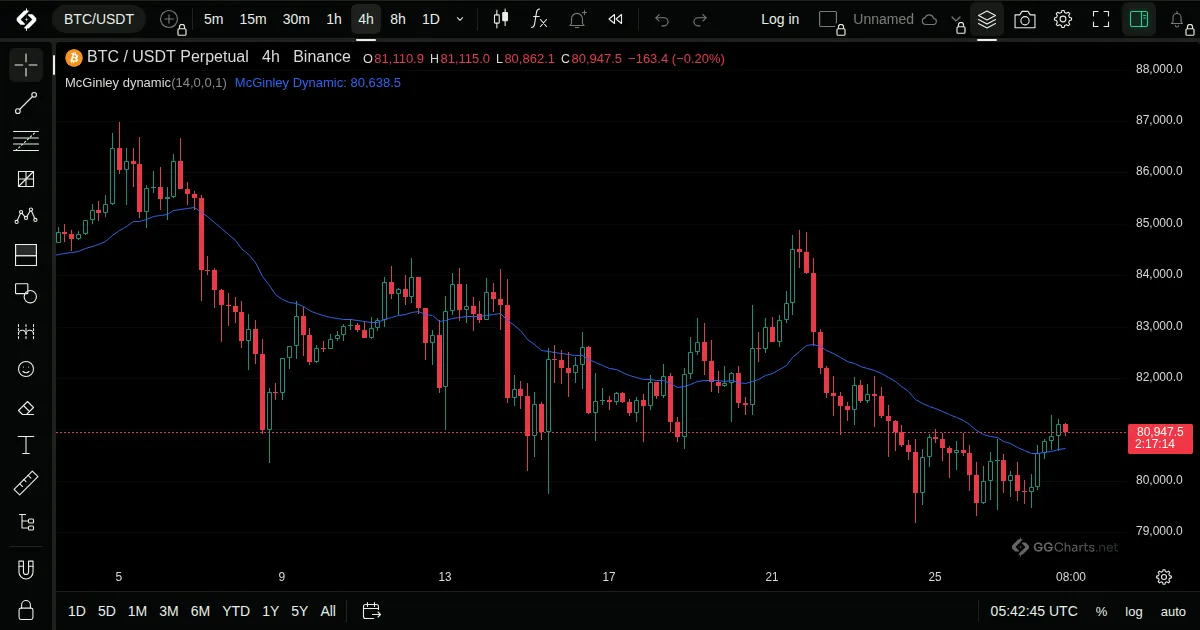
- What it shows
A moving average that adjusts its own speed to the market: it speeds up when price runs away and slows down when price is calm.
- How it is built
Each value moves toward the close by a share that depends on how far price is from the line, so the line avoids whipsaws.
Default: Length 14, source close.
- How traders read it
- Price staying above the line is read as an uptrend, below as a downtrend.
- It hugs price better than a fixed-speed average in fast moves.
- Used like a normal average, as support or resistance.
- History
Created by the market technician John R. McGinley, who presented it in 1990.
John R. McGinley, 1990