Least Squares Moving Average
Trend, LSMA
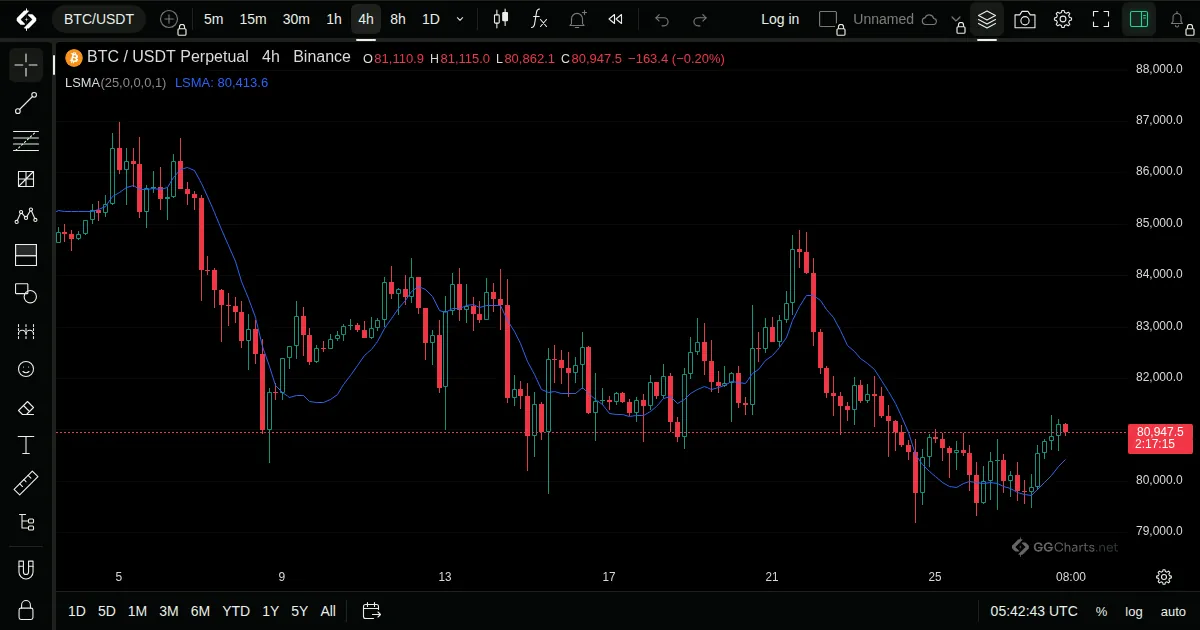
- What it shows
A line that follows the end point of a straight line fitted to the last N bars.
- How it is built
On every bar a least-squares regression line is fitted to the last N closes, and the value at its right end is plotted. An offset can shift the point.
Default: Length 25, offset 0, source close.
- How traders read it
- Rising means up, falling means down.
- Price crossing the line is watched as a turn.
- It can overshoot at sharp reversals.
Related indicators
McGinley DynamicMA CrossMoving Average RibbonAroon
Arnaud Legoux Moving Average← All indicatorsMcGinley Dynamic