MA Cross
Trend
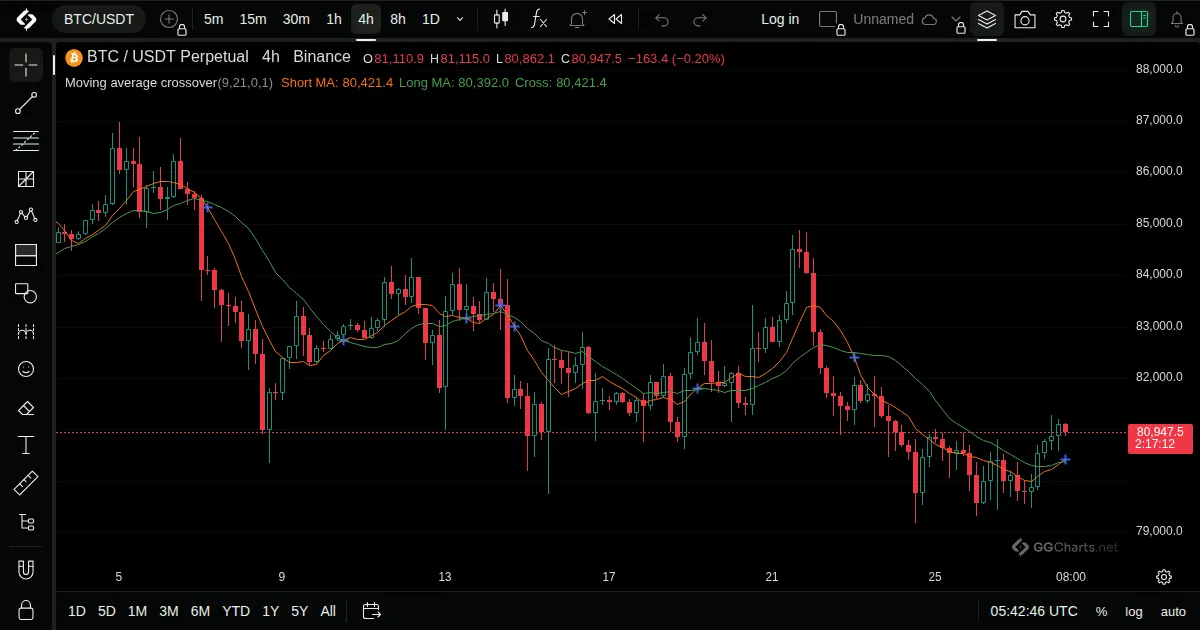
- What it shows
Two moving averages on the chart, a short and a long one. Their crossings mark a possible change of trend.
- How it is built
A short and a long simple average are drawn together, and a marker appears where they cross.
Default: Short length 9, long length 21.
- How traders read it
- Short crossing above long: bullish. Below: bearish.
- Crossings come after the move has started, so they lag.
- Many crossings in a row mean a range.