Ichimoku Cloud
Trend
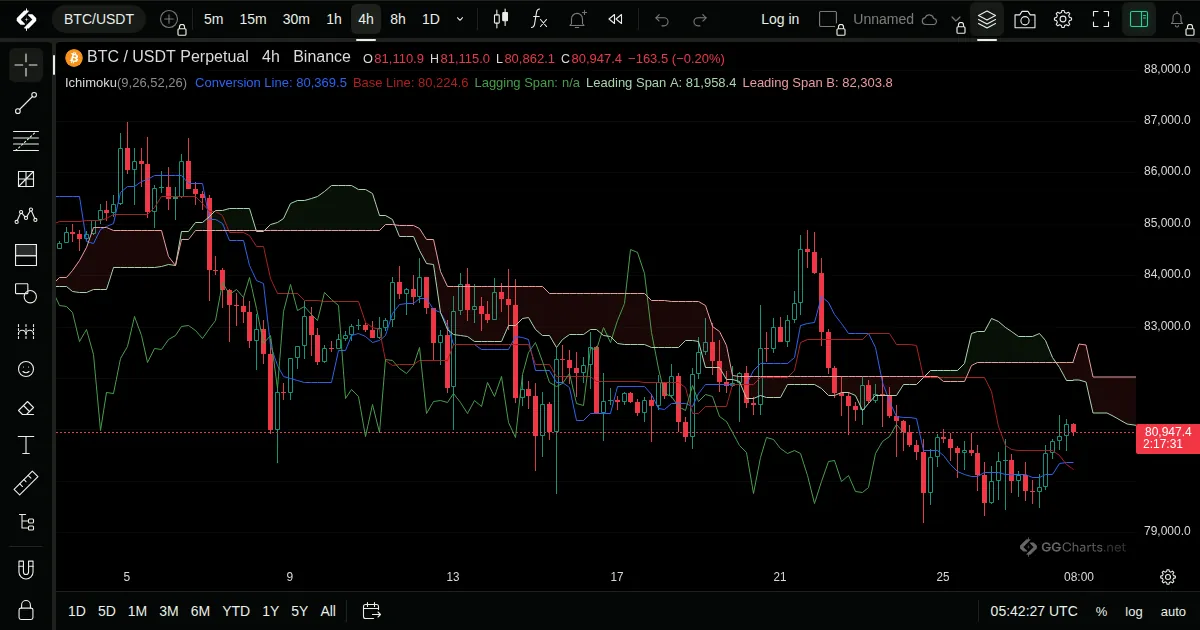
- What it shows
A set of five lines and a shaded cloud that show trend direction, momentum and areas of support and resistance in one view.
- How it is built
The conversion and base lines are the midpoints of the highest high and lowest low over 9 and 26 bars. The two cloud edges are projected 26 bars ahead, and the lagging span is the close shifted back 26 bars.
Default: Conversion line 9, base line 26, leading span B 52, lagging span 26.
- How traders read it
- Price above the cloud is read as bullish, below it as bearish, inside it as unclear.
- The conversion line crossing the base line is a short-term signal.
- A thick cloud is a stronger area of support or resistance than a thin one.
- History
Developed by the Japanese journalist Goichi Hosoda, who wrote as Ichimoku Sanjin, and presented to the public in the late 1960s.
Goichi Hosoda, late 1960s
Related indicators
Parabolic SARAverage Directional IndexDirectional Movement IndexHull Moving Average