Directional Movement Index
Trend, DMI
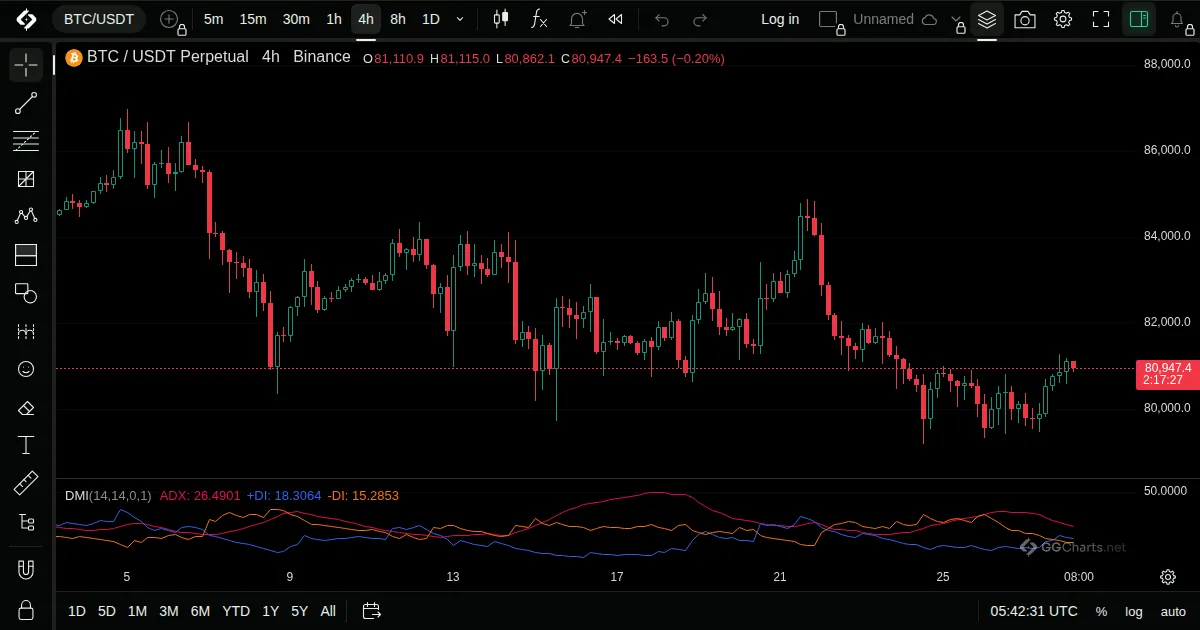
- What it shows
Three lines: +DI for the strength of upward moves, -DI for the strength of downward moves, and ADX for the strength of the trend.
- How it is built
Each bar's move beyond the previous bar's high or low is measured, smoothed over the period and set against the Average True Range to give +DI and -DI.
Default: ADX smoothing 14, DI length 14.
- How traders read it
- +DI above -DI favours buyers, -DI above +DI favours sellers.
- The two crossing is the classic signal, stronger when ADX is rising.
- A low ADX makes crossings less reliable.
- History
Directional Movement was published in New Concepts in Technical Trading Systems (1978).
J. Welles Wilder Jr., 1978
Related indicators
Hull Moving AveragePivot Points StandardBull Bear IndexDifferent Of Moving Average
Average Directional Index← All indicatorsHull Moving Average