Bull Bear Index
Trend, BBI
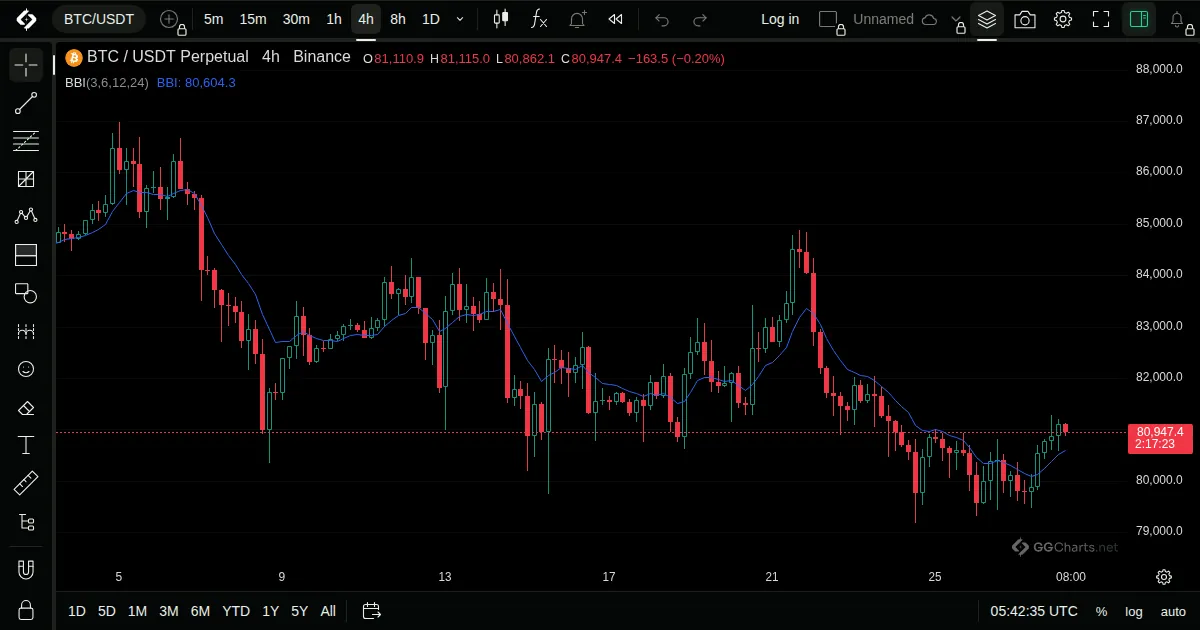
- What it shows
One line that blends four moving averages of different lengths into a single smoothed trend line.
- How it is built
It is the average of four simple moving averages, short to long, so it reacts less than the shortest and more than the longest.
Default: Set in the Inputs window.
- How traders read it
- Price above the line is read as bullish, below it as bearish.
- Crossings of price and the line mark a change of bias.
- A flat line means a market without a trend.
Related indicators
Different Of Moving AverageMoving Average WeightedDouble EMATriple EMA
Pivot Points Standard← All indicatorsDifferent Of Moving Average