Double EMA
Trend, DEMA
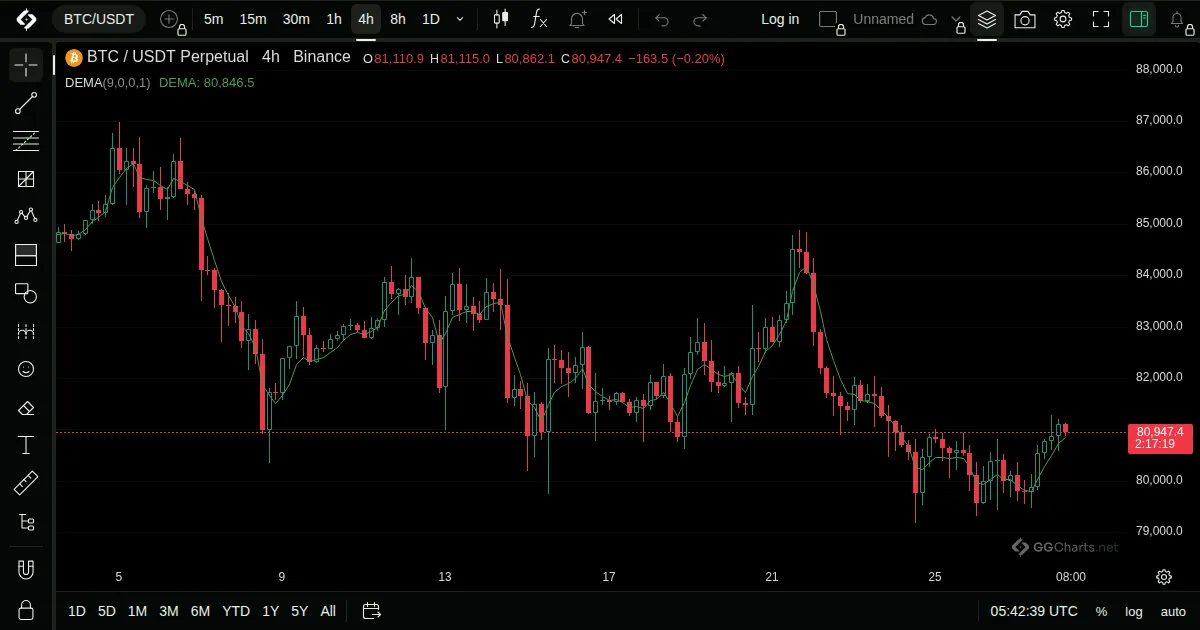
- What it shows
A faster moving average that cuts the delay of a normal EMA.
- How it is built
It doubles an EMA and subtracts an EMA of that EMA, which removes much of the lag.
Default: Length 9, source close.
- How traders read it
- Hugs price closer than a plain EMA.
- Crossing price or another average is the usual signal.
- More sensitive, so more false turns in a range.
- History
Described by Patrick Mulloy in Technical Analysis of Stocks and Commodities magazine, January 1994.
Patrick Mulloy, 1994
Related indicators
Triple EMAArnaud Legoux Moving AverageLeast Squares Moving AverageMcGinley Dynamic