Parabolic SAR
Trend
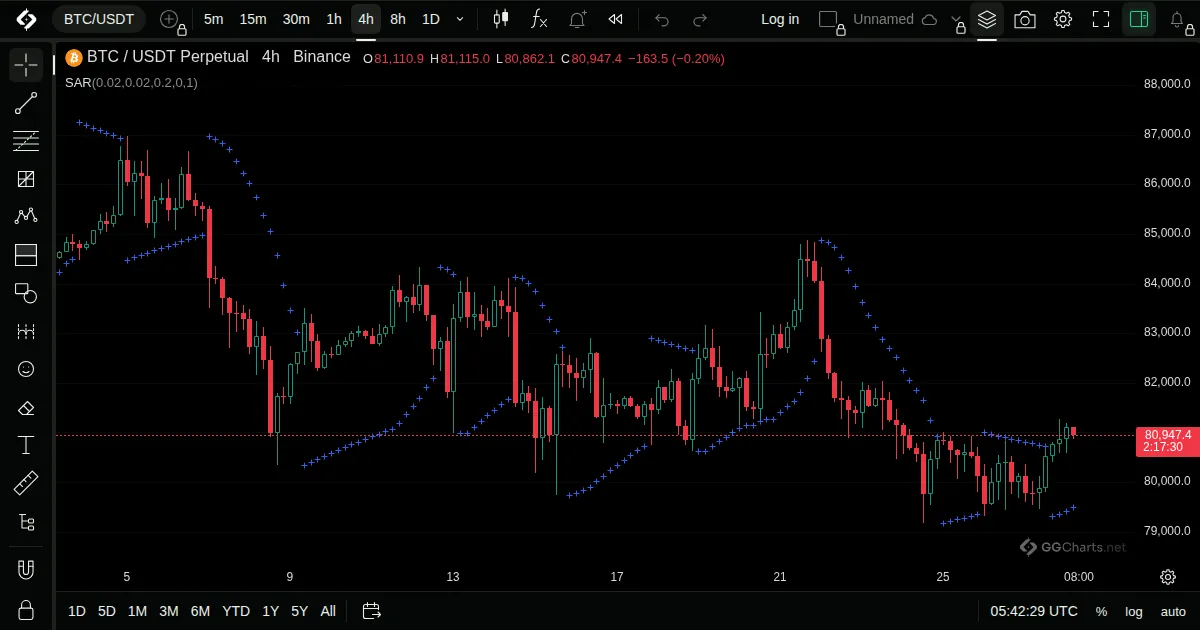
- What it shows
Dots that trail price: below the candles in an uptrend and above them in a downtrend. Each dot is a possible stop level that follows the move.
- How it is built
The dot moves toward price by a step that grows each time a new extreme is made, up to a limit. When price touches the dot, the indicator reverses and starts on the other side.
Default: Start 0.02, increment 0.02, maximum 0.2.
- How traders read it
- Dots below price: uptrend. Dots above: downtrend.
- A flip to the other side marks a reversal of the trailing stop.
- In sideways markets it flips often and gives many false signals.
- History
Published in his book New Concepts in Technical Trading Systems (1978), together with RSI, ATR and the Directional Movement system.
J. Welles Wilder Jr., 1978
Related indicators
Average Directional IndexDirectional Movement IndexHull Moving AveragePivot Points Standard