Supertrend
Trend
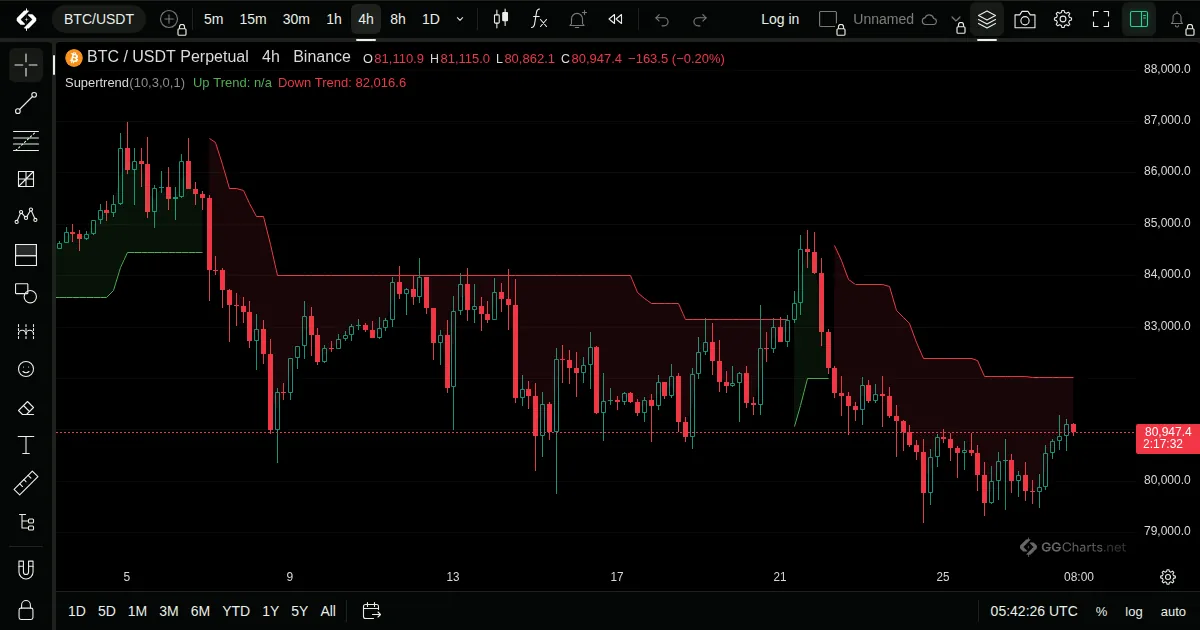
- What it shows
A line that trails price and flips side when the trend changes. It sits below price in an uptrend and above it in a downtrend.
- How it is built
The line is placed a multiple of the Average True Range away from the middle of each bar and only moves in the trend's direction. It flips when the close crosses it.
Default: ATR length 10, factor 3.
- How traders read it
- Green below price: uptrend. Red above price: downtrend.
- A flip of colour marks a change of trend, often after the move has started.
- Works best in trends. In a range it flips often.
Related indicators
Ichimoku CloudParabolic SARAverage Directional IndexDirectional Movement Index