Zigzag
Trend
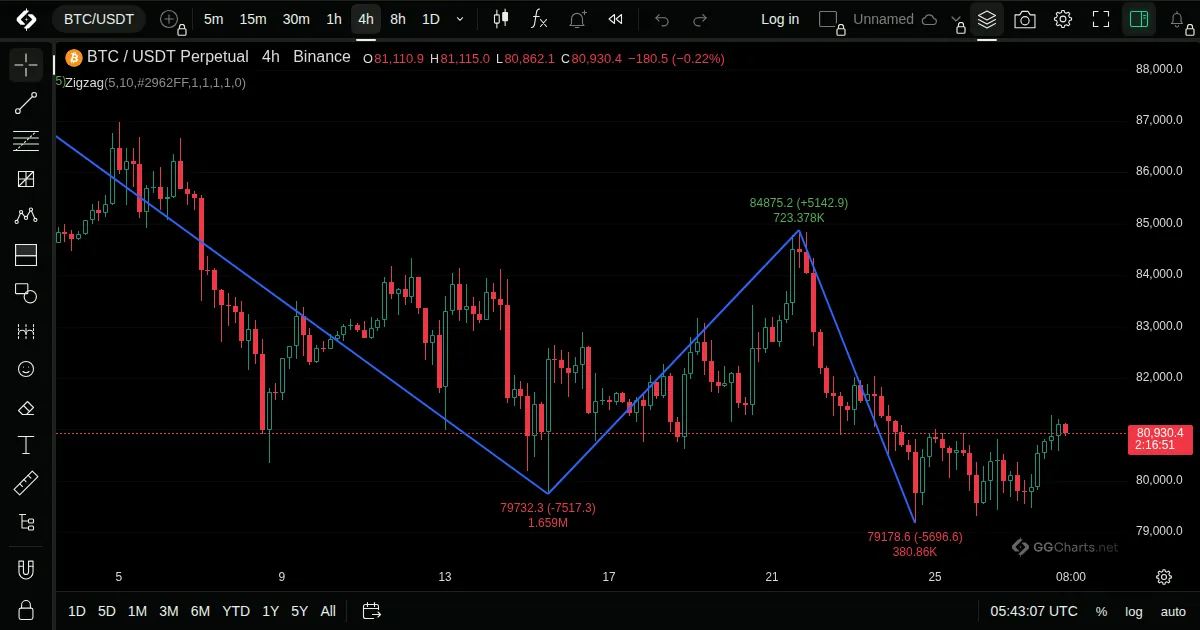
- What it shows
A line that joins the main swings of price and ignores the small moves between them.
- How it is built
A new leg is drawn when price reverses by more than the chosen percent from the last extreme, and the last leg can still change until a reversal is confirmed.
Default: Deviation 5 percent, pivot legs 10.
- How traders read it
- Makes the major swings easy to see.
- The last segment can be redrawn, so do not treat it as final.
- Useful for measuring swings and finding patterns.
Related indicators
GapsTrading SessionsRob Booker - Intraday Pivot PointsRob Booker - Missed Pivot Points