Trading Sessions
Trend
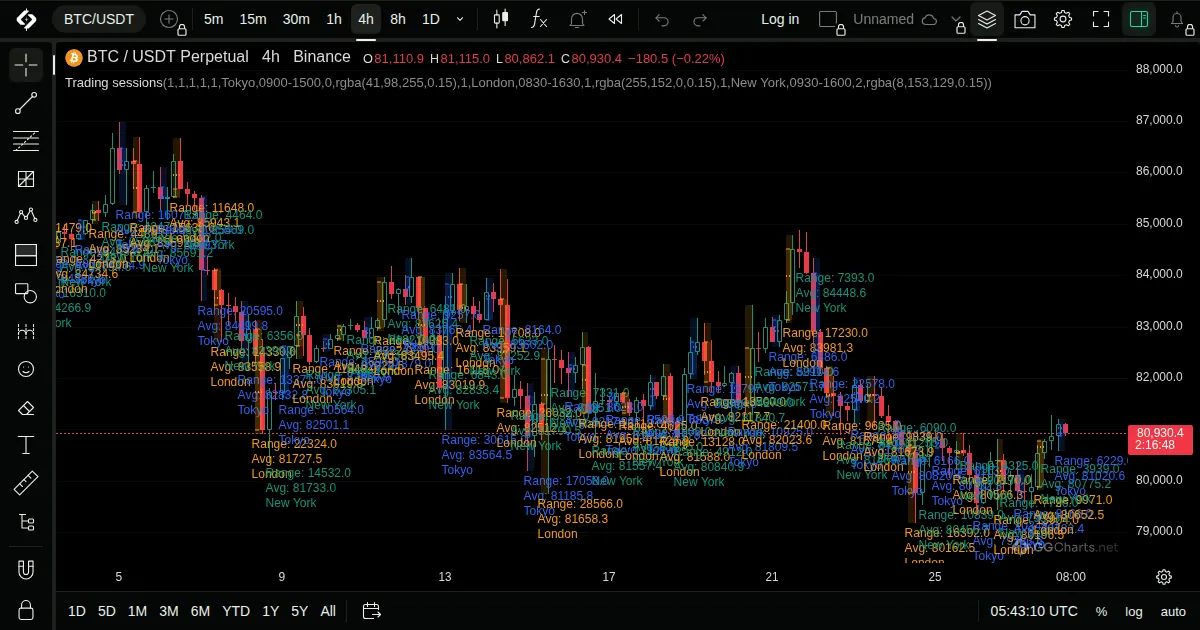
- What it shows
Shades the chart by trading sessions, so you can see which part of the day each bar belongs to.
- How it is built
Time ranges for market sessions are drawn as coloured backgrounds on the chart.
Default: Sessions are set in the Inputs window.
- How traders read it
- Shows how price behaves in each session.
- Useful for noticing when activity rises or falls.
- Session times are in the exchange time zone.
Related indicators
Rob Booker - Intraday Pivot PointsRob Booker - Missed Pivot PointsRob Booker - ReversalRob Booker — Ziv Ghost Pivots