Aroon Oscillator
Trend
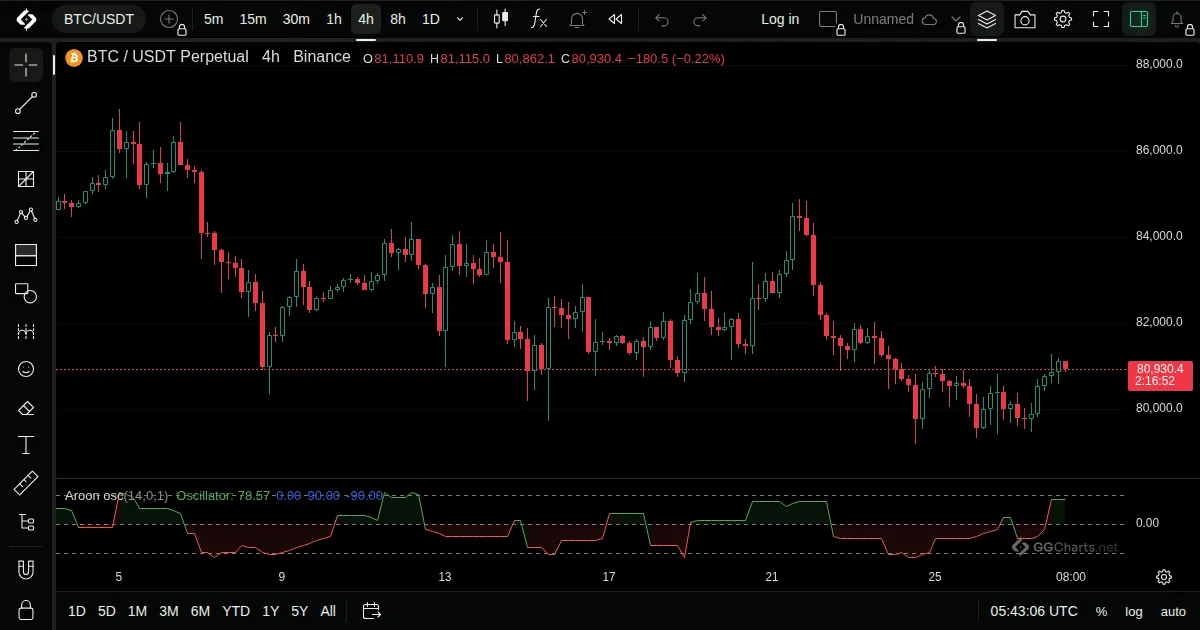
- What it shows
A single line that says whether recent highs or recent lows are fresher, as the gap of the two Aroon lines.
- How it is built
It is Aroon Up minus Aroon Down, giving a value between -100 and 100.
Default: Length 14.
- How traders read it
- Above zero: highs are more recent, an uptrend.
- Below zero: lows are more recent, a downtrend.
- Near zero: no clear direction.
- History
Built on the Aroon indicator introduced by Tushar Chande in 1995.
Tushar Chande, 1995
Related indicators
ZigzagGapsTrading SessionsRob Booker - Intraday Pivot Points