Pivot Points High Low
Trend, Pivots HL
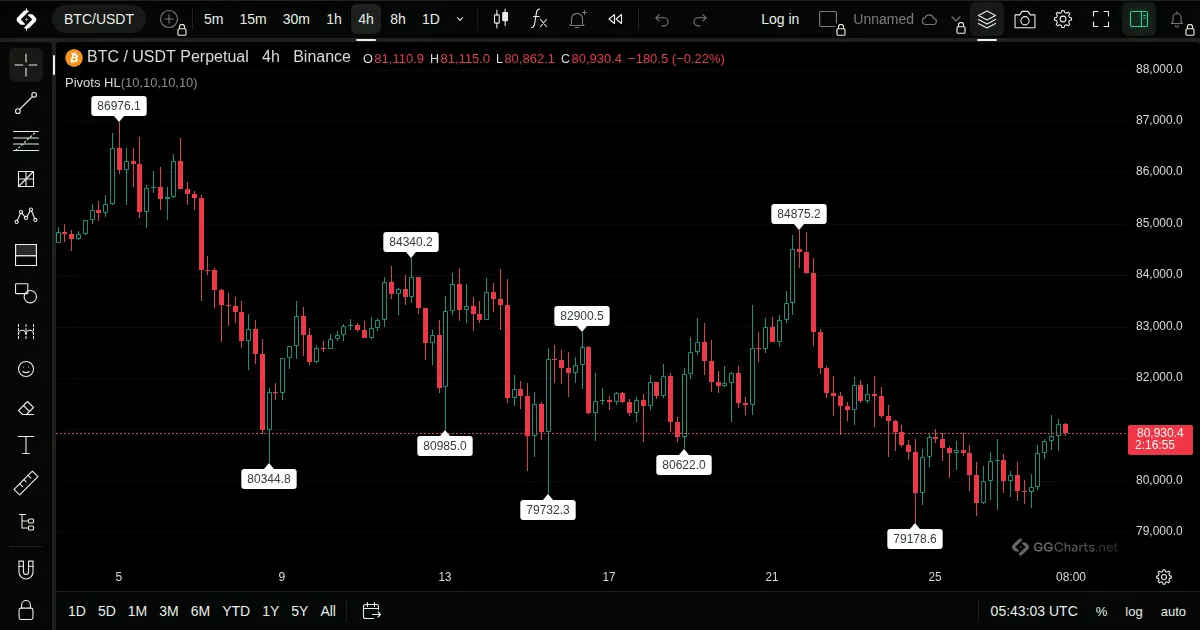
- What it shows
Marks on the chart where price made a local high or low, with lines to the next one.
- How it is built
A bar is a pivot high when its high is the highest within the chosen number of bars on the left and on the right, and a pivot low in the same way.
Default: 10 bars left and 10 right, for highs and for lows.
- How traders read it
- Pivots show where price has turned.
- They are confirmed with a delay equal to the right-hand length.
- Often used for support and resistance and for drawing trend lines.
Related indicators
Visible Average PriceAroon OscillatorZigzagGaps
Linear Regression Channel← All indicatorsVisible Average Price