Time-Weighted Average Price
Trend, TWAP
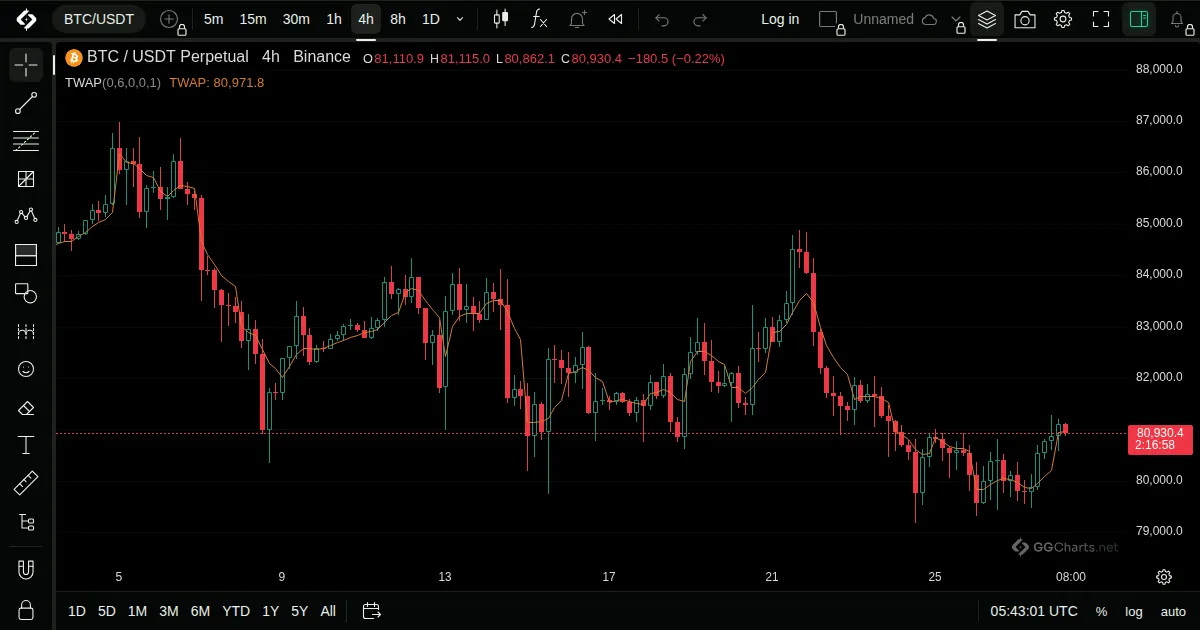
- What it shows
The average price of the period, with every moment counted equally, restarting at the beginning of each day, week, month and so on.
- How it is built
At each bar it averages the prices since the start of the chosen period, without using volume.
Default: Anchor period 1D.
- How traders read it
- Price above the line shows buying pressure in the period, below it selling.
- Used as a fair price for the period.
- It resets at each new period.
Related indicators
Linear Regression ChannelPivot Points High LowVisible Average PriceAroon Oscillator